
 Sun Tzu “In warfare, in keeping a nation intact is best, destroying a nation, second best”
This publication outlines an understanding of macroeconomics importance and social impact of the fiscal stimulus, especially during recessions, for example, the pandemic. To understand more on macroeconomic concepts, please refer to the online macroeconomic courses on The middle Road. This research article focuses on understanding the effects of the pandemic on the global economy from the lens of an economist. The read looks at selected policies proposed by President Biden and his team in the $1.9 trillion stimulus package. Concepts revisited here are aggregate demand and supply curve, the consumption function, etc. There are two ways of providing stimulus to the markets. One, monetary stimulus by reducing interest rates or using quantitative easing to increase liquidity within the system to boost credit uptake and drive consumption. Second is the fiscal stimulus that increases government purchases or lowers taxes to encourage consumption.
# Pandemic & Social Impact—Understanding Macroeconomics – Short Run Fluctuations

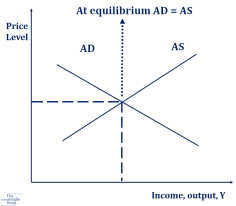
 The pandemic has created many social disruptions globally, including in the United States of America. The underlying forces governing short-term and long-term economies are different. Short-term prices are sticky, and any change in short-term economic fluctuations affects the aggregate demand (AD) within an economy; as the price level decreases, the aggregate demand curve slopes down. Since prices are sticky, any change in consumption, taxes or government purchases affects the AD curve, while aggregate supply (AS) depends upon technological innovation, labor capital, population growth, productivity, etc. At equilibrium AD = AS, however, this equilibrium is disrupted during the recession. For example, the pandemic. An economic disruption doesn’t affect prices but leads to changes in employment and output. In a recession, unemployment increases as firms cope with the dwindling demand, leading to a fall in the economy’s production. In the long run, shifts in Aggregate Demand impact price level but not output and employment.
LRAS: Long Run Aggregate Supply – Natural Level of Output *SRAS: Short run aggregate supply – Prices of goods and services sold *
 US $1.9 trillion stimulus to kickback the US economy in shape has many initiatives to enhance consumption within the economy. If passed into law the total stimulus package passed by the US would amount to $5.2 trillion, roughly ~25 percent of the 2019 GDP. The pandemic knocked out ~4,00,000 small businesses severely impacting the underprivileged and marginalized creating socio-economic inequalities within the system. The top 1% wealthy in the US made $1.5 trillion in the last year alone increasing racial inequality and social unrest. The unemployment rate peaked to a whopping 14.8 percent before coming down to 6.7 percent. This has resulted in about 18 million Americans on unemployment insurance causing one of the worst economic and health crisis for the US.
Source: President Joe Biden $1.9 trillion stimulus speech
However, the aggregate supply curve behaves differently in the short and long run. In long run, according to classical economics, prices adjust to the equilibrium and policies focus on Economic Growth. In the long-run economy depends on labor, capital stock, technology innovation, but in the short-run AD impacts output and employment. Budget stimulus boosts the aggregated demand within the economy through tax cuts or increased government spending, cuts in policy rates boost liquidity within the system to keep interest rates low. These policies catalyze increased consumer spending. An increase in infrastructure spending, R&D, training, and vocational courses are supply-side policies that boost productivity, increase labor participation, etc.
The recent policy to increase the minimum wage to $15 per hour is well thought of policy by the Biden administration. Minimum wage enables social change and impact through empowering marginalized and underserved communities globally.  Let’s take a look at both the demand and supply side of this policy.
Demand Side Economics: An increase in the minimum wage would increase the disposable income adjusted for propensity to consume. Example 40 hours per week per month translates into $2400 per month. If the marginal propensity to consume is 70 percent i.e. you will spend 70 percent of your earnings on goods and services i.e. $1680. If the existing minimum wage is $11, the increase in consumption is (15-11)*40*4 per month=$640 per month. Left Y = output, T: Taxes
Supply-Side Economics: Supply focused economists will say that an increase in the minimum wage would motivate people to work more than 40 hours per week as they now get to earn more wages for their output. They might be more diligent and productive, and also have an incentive to work longer hours and therefore be more productive. Ignore taxes and keep other factors constant.

One significant argument in favor of an increase in the hourly minimum wage is a rise in the gap between the productivity of American workers and hourly compensation. Based on the Economic Policy Institute analysis, from 1979 to 2018, net productivity increased by 69.6 percent, while workers’ hourly pay (real wages adjusted for inflation) rose only by 11.6 percent. This wage productivity gap remains one of the most decisive factors in enabling inequalities within American society. According to research (refer Mankiw), the maximum effect of an increase in the minimum wages is on teenagers, but for a couple with a minimum salary of $15 at 40 hours per week can translate to $2400 per month per person or $5600 per month for a couple. Considering purchasing price parity between different states within the US, increasing the minimum wage is uplifting for the country’s marginalized and less privileged population. The situation is even more glaring when the data from 32 countries are compared (OECD stat). Between 2001 to 2019, the US registered the lowest growth in real minimum wages per hour. (Germany is omitted as the minimum wage was introduced in 2015, Japan data until 2018). (OECD: Real hourly wages are calculated first by deflating the series using the consumer price index, taking 2019 as the base year. The series is then converted into a standard currency unit (USD) using Purchasing Power Parities (PPPs) for private consumption expenditures in 2019. The data includes 28 member OECD countries and four non-member countries.) The middle Road supports this initiative.
# Understanding AD and AS curve during the Pandemic
The pandemic caused businesses to lay off workers temporarily with micro, small and medium enterprises the worst hit. Globally many economies were performing well so there was no structural misgivings. In the recent pandemic, the spread of COVID-19 and the judicious shutdown of the countries to protect civic societies by limiting the spread of the virus led to loss of jobs. Temporary shutdowns lead to decreased productivity and rise in unemployment, shifting the natural level of employment/output to the left. (LRAS1). Below Fig 1


Further, the amount of money withheld by the households increased, reducing the velocity of money M2*. (Refer to Mankiw). As lockdowns were imposed around countries backed by much uncertainty surrounding the virus, fear spread out among the people. There was a lot of misinformation regarding the spread of the virus, and people avoided purchasing goods except for the necessities. This is partly true during the earlier part of the pandemic when the uncertainty of the spread of the novel coronavirus was at its peak. As uncertainty loomed and little information was known about the virus (there is much to be discovered about the novel virus now, especially how severely COVID-19 mutates). As transactions decreased, the velocity of money reduced, lowering the supply of money within the economy. Recall M2 is a broad money supply, and the U.S. comprises small-denomination time deposits, savings deposits, money market deposits, and mutual funds. M.V. = P.Y., a fall in the velocity of the money-keeping money supply constant leads to a fall in the output (nominal GDP). A fall in the output within an economy leads to a fall across all price points of the aggregate demand curve leading to a fall in output. The A.D. curve shifted downwards with the equilibrium point moving from P1 to P2, lowering the output of an economy. Refer to Fig 1.
Aggregate Demand is also defined as the total output of the economy given by Y = C+I+ G+ NX for an open economy where C: Consumption, I= Investment, G: Government Purchases. NX= Net Exports. To understand short-term fluctuations it’s better to delve further into the IS-LM model and for Long Term Growth check out the module on Production Function.
Production Function : AKαL1-α As technology and innovation increases over time, the productivity of labor increases exponentially. AKαL1-α where A = Total Factor Productivity or Productivity, the share of labor and capital is fixed. α=0.3 for Cobb-Douglas Production Function. In an economy, factors of production are fixed i.e. K = Capital and L = Labor with output depending on the level of technology.
 Population growth is a critical factor in sustaining labor force participation over time. The fertility rate is essential to understanding labor force participation through the dependency ratio. United Nations defines working-age population range from 15 years to 64 years. Dependents are defined as those with fewer than 15 years and those above 65 years. A decrease in the fertility rate initially increases the output per capital due to the reduction in younger dependency, i.e., a decline in population from 0 to 14 years. This period is known as Demographic Dividend –Window of Opportunity. However, over the long term, the dependency ratio increases as the number of people older than 65 increases along with a decrease in the working population. This information becomes very relevant during the discussion of Solow’s model.
# Show me the money “Second Thoughts”
 Show me the money, an iconic scene with Tom Cruise and Cuba Gooding Jr.’s classic movie Jerry Maguire. Jerry Maguire is an epic film and shares a holistic message on client management. The middle Road rates Cuba Gooding Jr Oscar-winning role as one of the finest performances on celluloid of all time. Both the movie and Cuba Gooding enter the fall of fame. The middle Road also rates this as one of Tom Cruise’s best performances, along with A Few Good Men. The middle Road will soon be coming out with its best films and artists under the Art & Culture category. The movie also launched the career of academy award-winning actress Renée Zellweger. The paramount issue facing the US would be how to fund the stimulus. Printing presses would not be the optimal route to look at existing debt levels. The other way would be to increase taxes on the top 10 percent of the population and prune expenses in specific sectors, significantly military expenses.
# Inequalities & Taxes: Blistering Barnacles
Captain Haddock is undoubtedly one of the most adorable characters in the comic genre. People who grew up reading Tin Tin can envision Captain Haddock’s reaction to hearing about the American debt. Bombastic but with childlike innocence, Captain would have understood the need for the stimulus and debt to help millions of Americans fight back the pandemic. Within the last three decades, economic inequality has risen considerably in the US particularly hitting the marginalized and underserved sections of the society hard. To read more about the socio-economic inequalities within India read the publication here. The US has a Gini Coefficient of 0.390, one of the highest among advanced countries, a broad measurement of inequalities within the US society. (Gini Coefficient ranges from 0 which is complete equality to 1 i.e. complete inequality. To know more refer to the Inequality publication on The middle Road here. Pew Research “In 1989, the richest 5 percent of families had 114 times as much wealth as families in the second quintile (one tier above the lowest), at the median $2.3 million compared with $20,300. By 2016, the top 5 percent held 248 times as much wealth at the median. (The median wealth of the poorest 20 percent is either zero or negative in most years we examined.” America suffers from both racial and gender inequality. Based on the Census.gov, the estimated earnings for men and women for 2019 ignoring margin of error at 90% Confidence Interval is 57,456 and 47,299 with a ratio of 0.823. Americans would have to look at European countries to formulate a more equitable tax structure. As more stimulus is expected to push infrastructure, manufacturing, R&D agenda, raising taxes both for the wealthy and corporates is given.
# Military Spending

One significant aspect of policy revision is to revisit military spending. According to an analysis by Stockholm International Peace Research Institute, the US is second only to Israel in military expenditures per capita. In absolute terms, US military spending is more than the combined military spending of China, India, Russia, Saudi Arabia, France, Germany, United Kingdom, Japan, South Korea, and Brazil. (Peter Peterson Foundation). The US spent on an average 3.5 percent in military expenditure from 2013 to 2019, a significant amount for a country that is the largest economy in the world in absolute terms. (In terms of purchasing price parity, China is the largest economy globally). A lot of this spending is redundant considering that the significant military threats to the US have not come from enemies. The US spent an astronomical sum on the star wars programs during the cold war era with the Soviet Union. Yet, the first terror attack by terrorists, the attack on the World Trade Centre, occurred due to the intelligence failure of government agencies in the US. 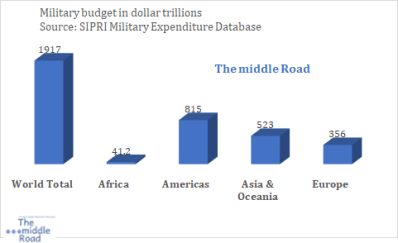 The recent US Capitol Hill Siege highlights the risk of proliferation of guns among the civic society and the ease of manipulating the masses through conspiracy theories that are so ridiculous that it will be an outlier even among fiction enthusiasts. In 2017, only 44.4 percent of adults aged 25 years and higher had received an associate degree or higher, although a rising trend, a massive discomfort for a country that is a paragon of education. The US has by far more research-based universities than any country globally. Yet, less than half of its adult population has an associate degree. Higher is less of a paradox if you understand how Americans have been sold on the American dream of entrepreneurship. Chart: Above right selected military expenditure per capita per country in USD | The middle Road
Research has shown that people with higher education and experience have a much greater probability of success than people with no undergraduate education. Trickledown economics remains one of the greatest disasters in the modern policy-making era. A critical policy would be to bring awareness among the teens on the importance of higher education while making post-graduate education affordable and accessible. This will blow up the delusion among the Americans about the entrepreneurship bug without a solid educational foundation. Take military spending as an example. Americans trillions of dollars on F-35, a fifth-generation plane with superior stealth capabilities (other fifth-generation planes include F-22 Raptor and J-20), and yet it remains a suspect on its effectiveness notwithstanding frequent crashes. One critical step would be to cut down the defense budget systematically and at the same time become more efficient and productive in developing weapons. Swedes built a GRIPEN line of fighter planes at a fraction of the budget of F-35. Although GRIPEN is strictly not a fifth-generation yet possesses significant stealth and multipurpose bomber capabilities. Systematically but thoughtfully reduce the military budget to free up enormous capital for wholesome purposes.
Sun Tzu, lived about 2500 years ago and author of the book Art of War.
References
President elect Biden announces American Rescue Plan
- US Bureau of Labor Statistics
- Economic Policy Institute
- Stockholm International Peace Research Institute
- American council on Education
- OECD Stats
- AP news
- Moody’s : The Biden Fiscal Rescue Package: Light on the Horizon
-
Further reading
WEF: Productivity vs wages: How wages in America have stagnated